A quick project that primarily showcases making Flows in Power Automate to automate processes, as well as visualizing KPI cards and trends of correlated data.
Why care about interest rates?
After a decade with low interest rates in Sweden, where borrowing money was more or less free, inflation and a turbulent world led to a sharp increase in a short time. The Swedish central bank Riksbanken increased the policy rate from 0% in early 2022 to 4% at the end of the next year, which has put a financial strain on many homeowners and businesses. As a result, investments and transactions have decreased drastically which has caused the economy to halt.
Writing this in the fall of 2024, interests rates have likely peaked but are still high, and keeping track of where they are headed have become much more important as many are waiting for the right moment to buy that house, or launch that project.
You can find the most recent interest rates for different types of loans, term lengths and so on, on different websites. But it can be difficult to do a proper analysis on single data points; how does today compare to yesterday? Last month? Last year? Datasets with historic rates definitely exist, but usually requires quite hefty subscription fees if you want to access them. Looking up the daily rates and writing them down to start building a dataset is possible in theory, but time-consuming to do manually.
What data do we need?
The policy rate is the main tool for monetary policy and serves as the benchmark for other interest rates and is definitely good to have.
However, we also want something that represent the offered market rates, as interest on loans is something different than the policy interest rate. For this we can use and SWAP.
STIBOR (Stockholm Interbank Offered Rate) is the average interest rate at which major banks in Sweden lend to one another and is good reference rate for loans and financial contracts, especially on the short term market. For medium and longer term loans, SWAP rates show what the rates are offered for fixed term loans for businesses.
Getting the data
For the policy rate the process is quite straightforward. The Riksbank has an open REST based API where you can get historic and actual rates in JSON format. Great!

Bottom: Documentation around one possible queries
STIBOR and SWAP is a bit more work. We want to find data that can be read and stored automatically somewhere. There is no available API here to use but today’s values can be found on Dagens Industri (STIBOR) and SEB (SWAP).
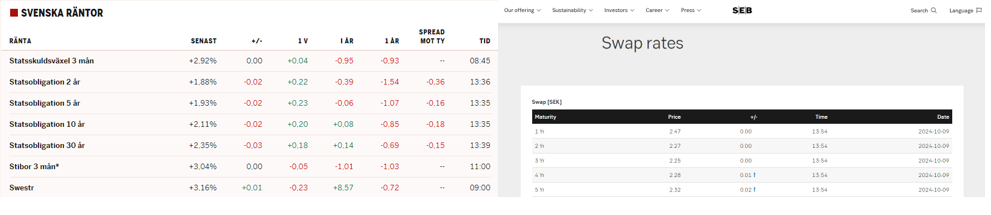
Basically what we want to do is (1) Get the latest values and (2) Add them to a table where historical values are stored.
Extracting a specific value from a HTML page can be a bit tricky, but using Power Query you can see what is happening on each step on the way work your way forward. I managed to get two clean tables containing the most recent values for STIBOR and SWAP. For SWAP I picked two term lengths, three and five years, to get some perspective on how different medium length terms vary. I published these values as a semantic model in Power BI and set a schedule to refresh the data every day.
So with that we have a dataset with a couple of data points that refresh on a daily basis. There are then different ways to write these values to a fact table. Since this is more of a personal project I chose the cheapest rather than maybe best practice method for this: using Power Automate to write to Excel. In a company with a bit more resources for storage solutions and Microsoft subscriptions, this could just as easily be done pointing to a suitable table in a lakehouse or SQL warehouse.
I won’t go into detail in every step of the flow in Power Automate, but it was structured like this:
- Look up the latest STIBOR and SWAP rates from the published semantic model
- Check the fact table if this data is new. If yes: add the latest rates to the fact table.
- Send an email to let me know what happened (success or not)

After letting the flow and model do their thing for a few weeks the once empty fact table was now beginning to have something to work with. Sure, I don’t get data from before I set up this and there will be things to rewrite if SEB or Dagens Industry changes their websites, but it’s a decent enough solution if you’re not keen on paying the annual subscription fee of € 3,250 (for STIBOR alone) that I saw that one financial institution charge.
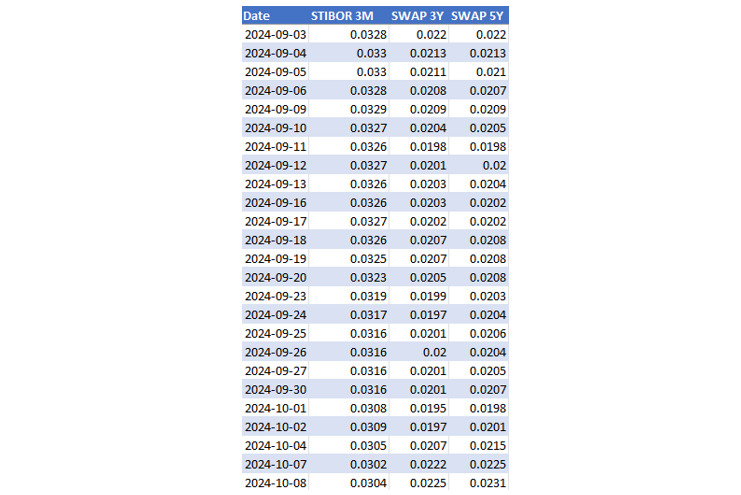
Creating the report
So now that we are done with the data the only thing left is the report.
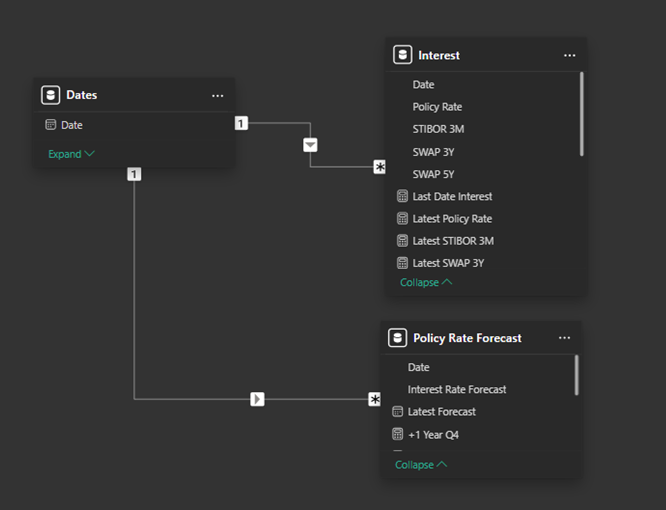
The model is simple. We have a table for STIBOR and SWAP and we just need to add the policy interest rate. One call to the Riksbank API gives historical data and is merged with the STIBOR/SWAP table. One call that returns forecast data is stored separately.
Finally I added some KPI cards and a line graphs where the user can compare and see trends. The thin line on the blue header shows how the policy rate has varied from 2000 to today. A nice little visual touch, I think. This data could then be used on its own or together with other information to allow for analysis of trends. For example, a developer could use this together with housing trends data in order to determine when the optimal time to start construction projects, predicting both financial costs during construction as well as what financial market prospective buyer’s will be in once the buildings are completed.
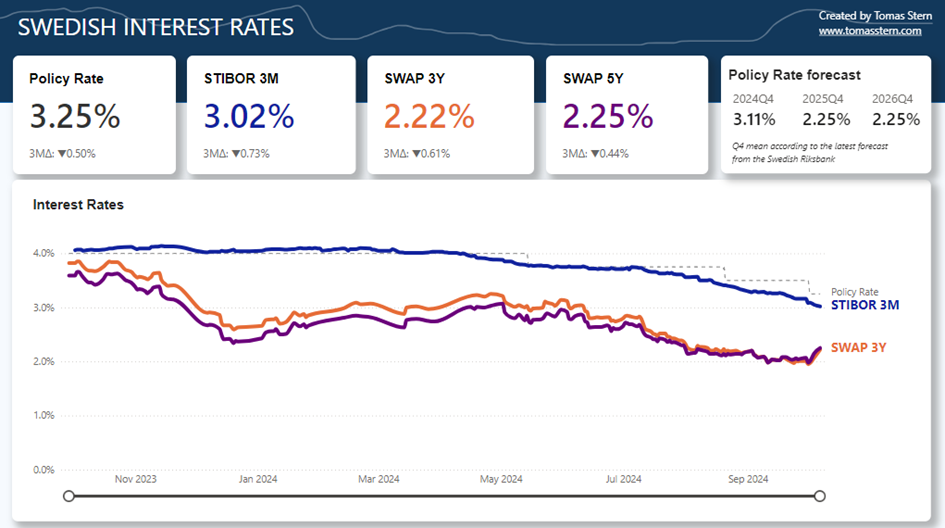
Looking at the screenshot from today, all rates are down in the past three months. STIBOR is a good “predictor” for what market thinks the Riksbank will (should?) do with the policy rate. At time of writing early October, STIBOR is almost a full 25 points below the current policy rate, which would indicate a strong belief that the Riksbank will decide on lowering the rate at the next policy meeting.
Let’s hope they do. I have mortgages to pay.